Multi-quantitative tracks
JBrowse can show "Multi-quantitative tracks" which is a single track composed of multiple quantitative signals, which have their Y-scalebar synchronized.
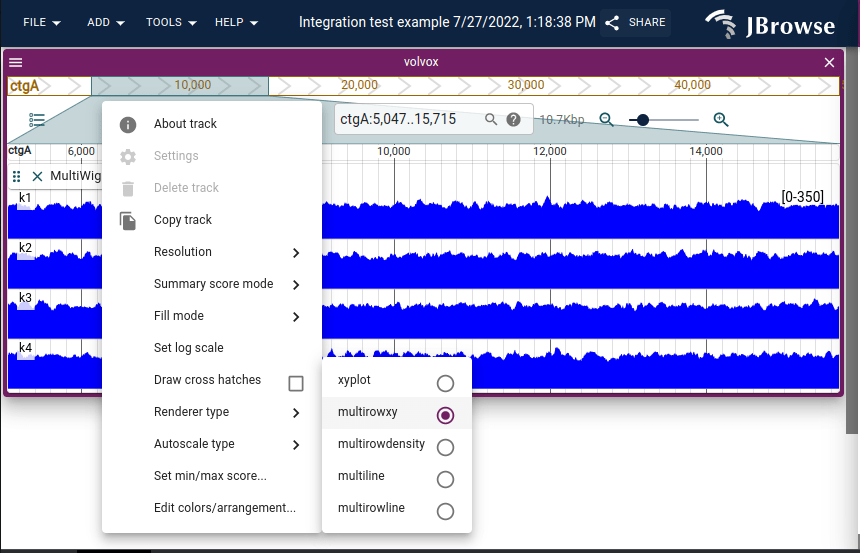
There are 5 rendering modes for the multi-quantitative tracks.
- xyplot
- multirowxyplot
- multiline
- multirowline
- multidensity
You can interactively change these settings through the track menu.

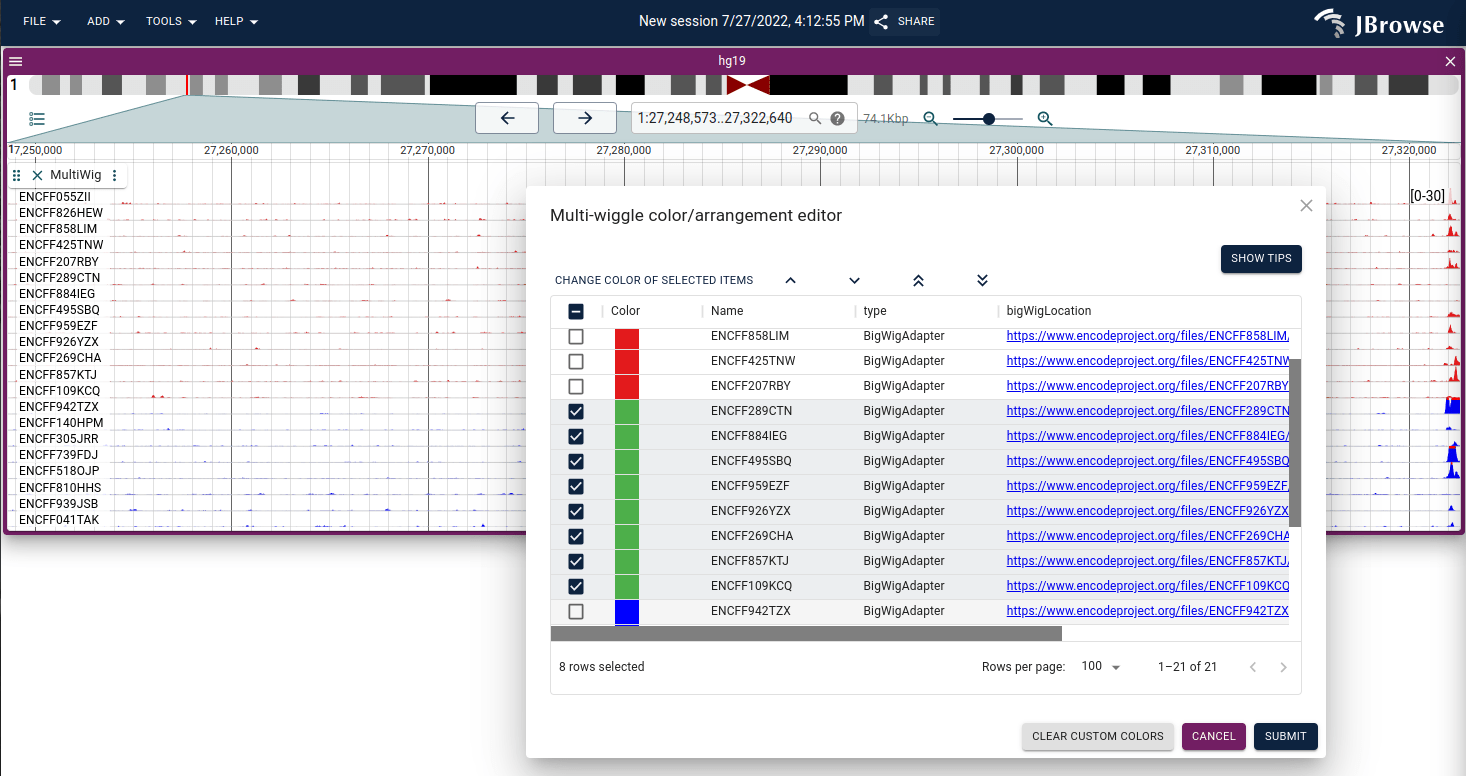
With the "multi-row" settings (multirowxyplot, multirowline, multidensity) the track colors are not modified. For the overlapping (xyplot, multiline), the tracks will be autoassigned a color from the palette. You can manually customize the subtrack colors from the track menu as well.

Oftentimes, one of the outliers on one of the subtracks may affect the Y-scalebar too much, so it is often helpful to use the "Autoscale type->Local +/- 3SD" setting (3 standard deviations are displayed). Manually configuring the min or max scores is available via the track menu also.
Adding multi-quantitative tracks via the UI
There are several ways to create multi-quantitative tracks from scratch.
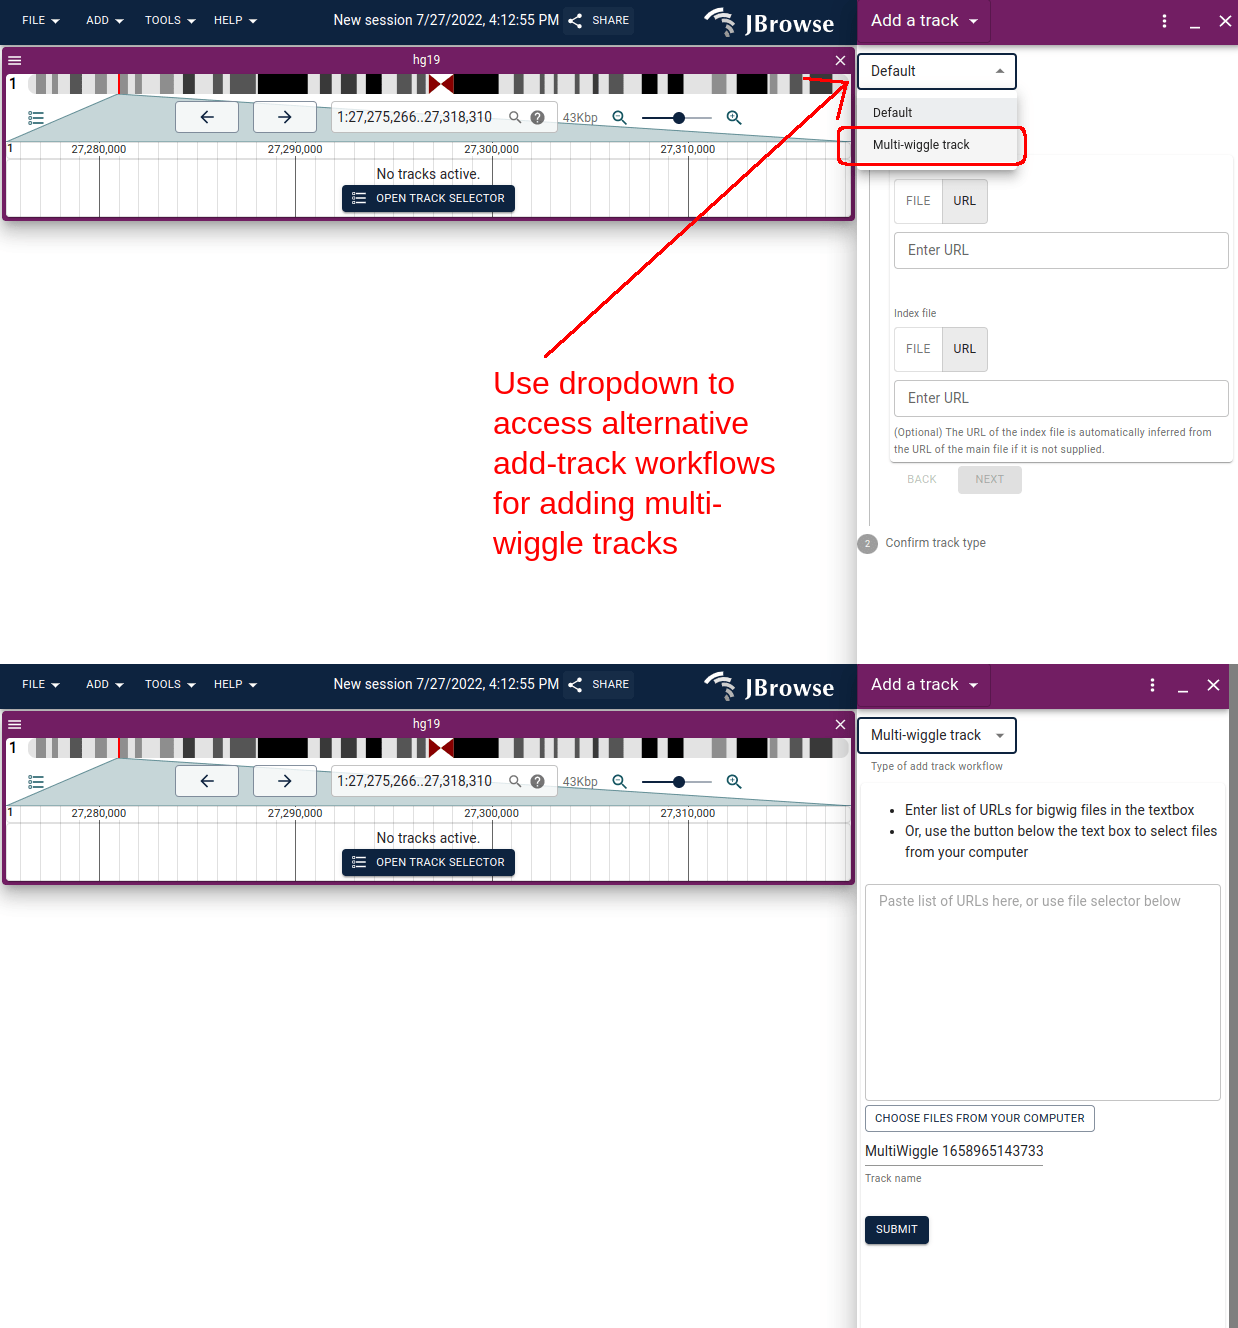
- Using the add track panel to open up a list of URLs for bigwig files, or from several local tracks from your machine
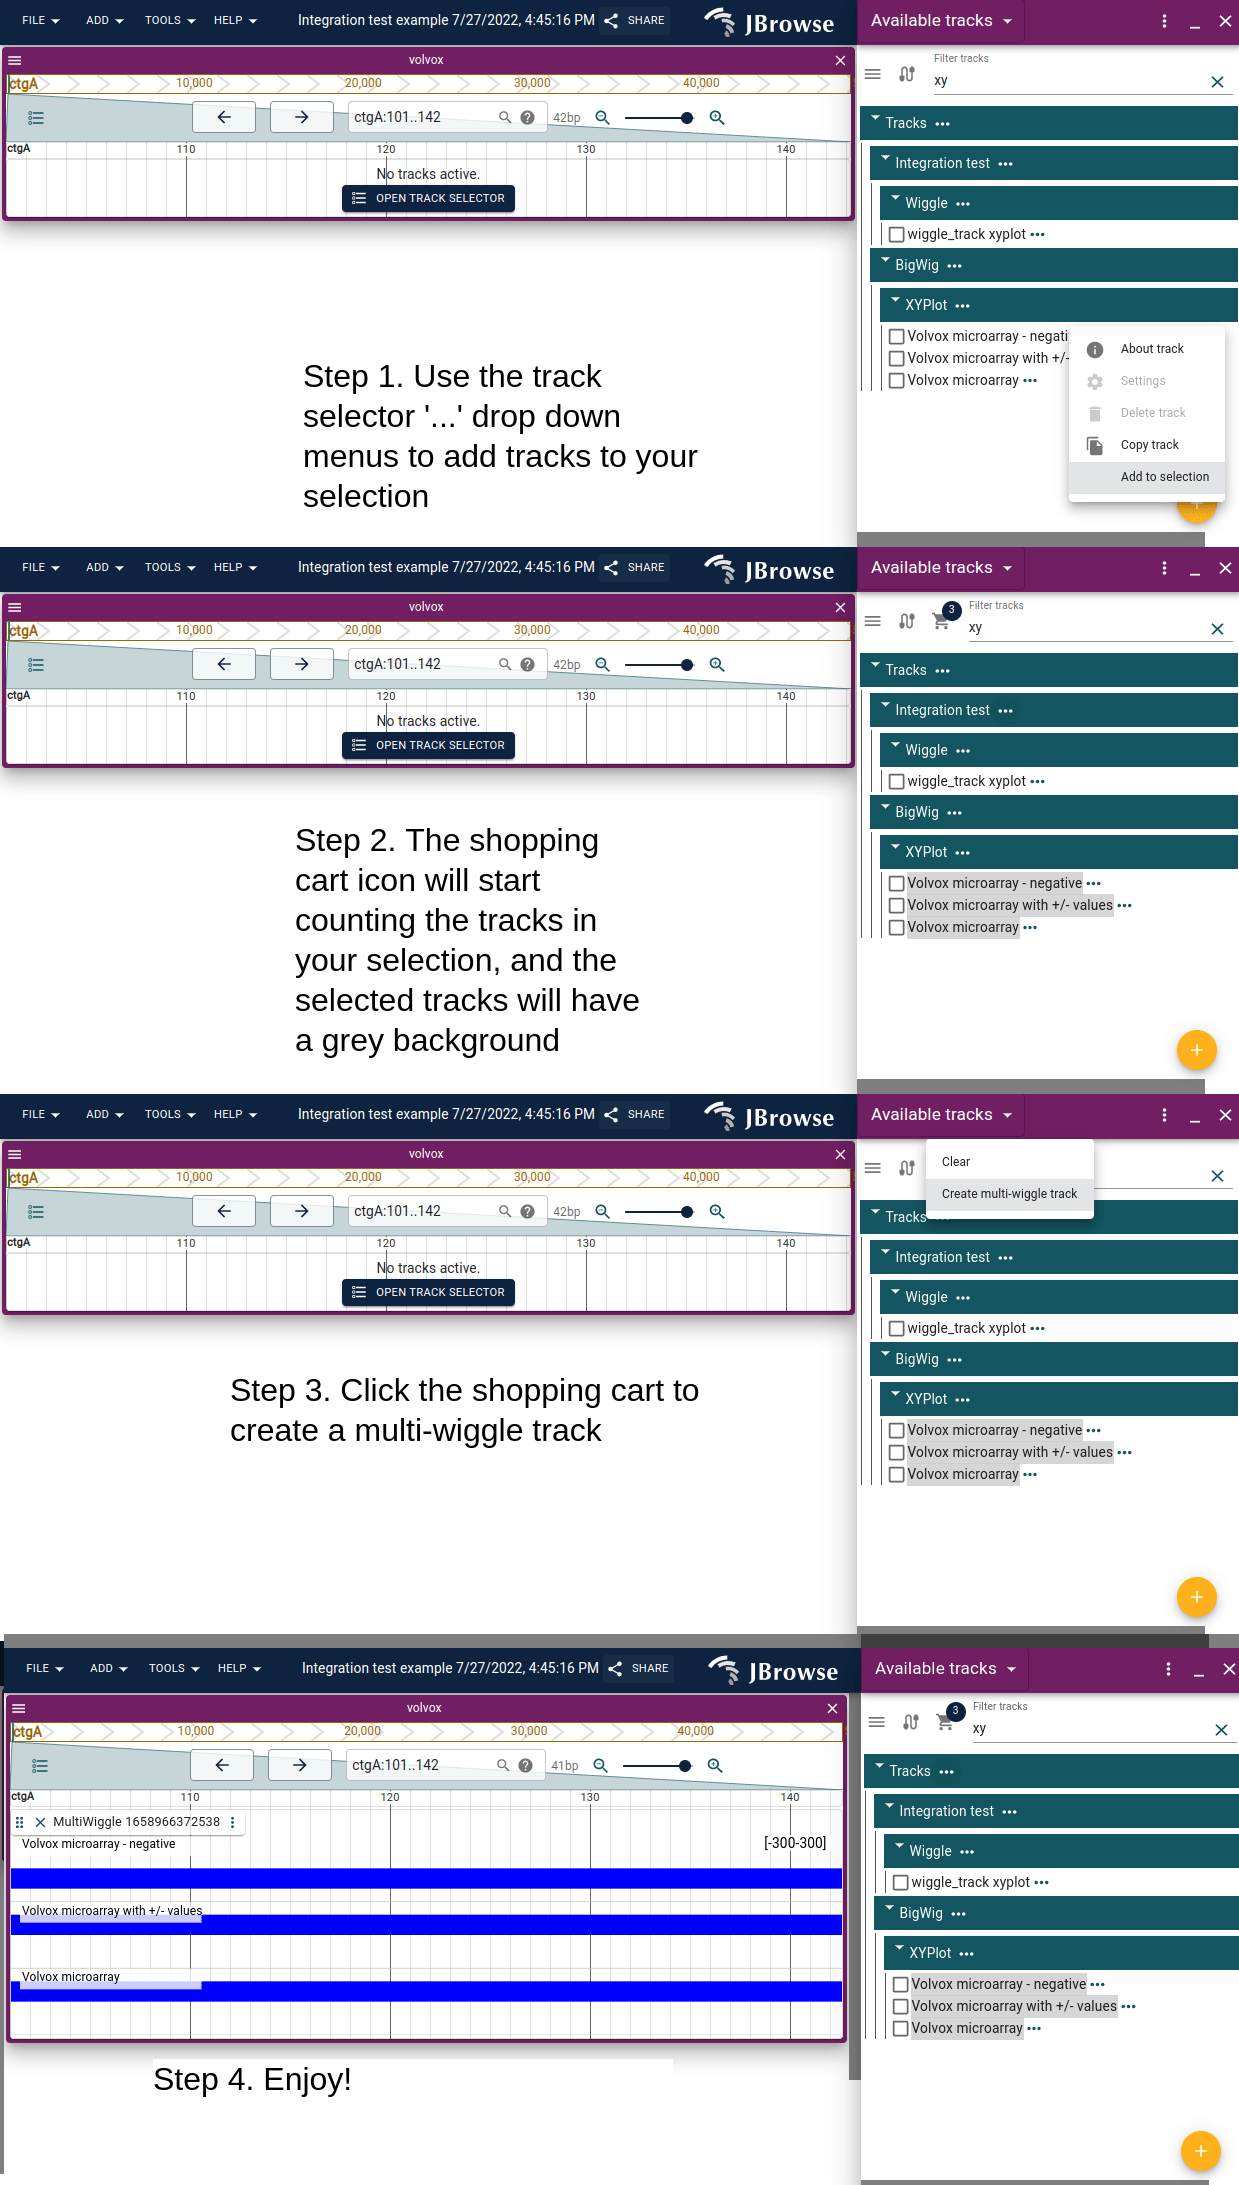
- Using the track selector to add multiple tracks to your current selection, and then creating a multi-wiggle track from the tracks in your selection
- Hardcoding the multiwiggle track in your config file (see multi-quantitative track configuration for more info)

